I still catch myself glancing at average FPS first. Muscle memory. Then the frame-time graph loads, and the story changes. Real-game benchmarking is the controlled measurement of how your PC hardware actually delivers frames while a game engine is busy doing game things—physics, AI, streaming assets, driver calls, the whole stack.
What's Inside
- Defining Real-World Game Benchmarking
- The Limitations of Synthetic Stress Tests
- Decoding Frame Times and 1% Lows
- Preparing Your System for Consistent Testing
- Selecting Games and Repeatable Test Paths
- Capturing and Interpreting the Performance Data
- The Reality of Frame Pacing
Defining Real-World Game Benchmarking
Real-world game benchmarking measures frame rendering times and system behavior during live gameplay. You log milliseconds per frame across a capture window that spans 60 to 90 seconds of active play. That window is long enough to expose hitch patterns and short enough to keep the path repeatable.
Synthetic suites isolate a component with artificial, math-heavy workloads. Useful tools. Different question. A game engine pulls the CPU, GPU, RAM, and storage into one timeline. Bottlenecks move. Driver overhead shows up. API paths matter. When I want to know how a rig feels in gaming, I start with that holistic loop—not a theoretical compute ceiling.
Think of it as instrumentation for the full pipeline. The number that matters is how long each frame took to leave the system, not how hard a single chip can thrash a shader compiler under a synthetic test load.
The Limitations of Synthetic Stress Tests
Synthetics answer a clean question: how much sustained compute can this part deliver? They often pin one component at maximum utilization for 20 to 30 minutes. That is excellent for thermal stability checks and overclock validation. Thermal soak runs of 15 to 20 minutes tell you whether clocks hold and whether the cooler keeps pace.
Games refuse to cooperate with that model. One frame is GPU-bound in a dense particle burst. The next stalls on draw-call submission or streaming. The bottleneck shifts frame by frame. Synthetic scores miss engine quirks, driver overhead, and API inefficiencies that only appear when the full software stack is live.
I still run synthetics before serious game passes. They confirm the silicon is stable. What they cannot predict is smoothness once a title starts juggling simulation, culling, and present calls through the DirectX graphics pipeline.
Stability Only
Treat long synthetic burns as thermal and overclock safety checks. Keep them out of your gameplay ranking tables.
Decoding Frame Times and 1% Lows
Average FPS is a headline. Frame-time consistency is the plot.
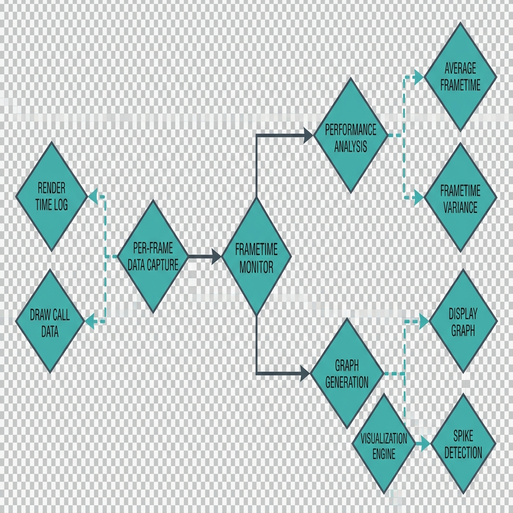
A 1% low isolates the slowest 1% of frames rendered during the test period and expresses that tail as an effective rate. Those slow frames are what you feel as hitching. Frame-time graphs plot each delivery in milliseconds, so a spike is visible instead of diluted into a friendly average.
Relying solely on average frame rates masks severe frame-time spikes of upward of 40 milliseconds that cause visible stuttering. You can post a high average and still ship a slide show every time the camera swings through a heavy scene. When I review a run, I read the graph first, then the averages. If the line looks like a seismograph, the experience will too—no matter what the mean claims.
Preparing Your System for Consistent Testing
Dirty environments produce confident nonsense. Before any logging pass, lock down the machine so the only variables left are the ones you intend to measure.
Thermal Normalization First
Cold boost clocks lie. Components need time at load before clocks settle into sustained behavior. Run the selected game for 10 to 15 minutes of active gameplay before you start data logging. That warm-up is the difference between a launch spike and a representative sample.
Kill the Background Noise
Disable non-essential background OS tasks and startup applications. Pause store downloads. Close overlay stacks you are not using for capture. Keep ambient room temperature consistent across sessions so thermal headroom does not drift between runs.
Pre-Run Lockdown
- Close all non-essential background applications and hardware monitoring tools not actively used for logging.
- Pause all background OS updates and digital storefront downloads.
- Run the selected game for 10 to 15 minutes before initiating capture.
- Confirm ambient room conditions match prior sessions when comparing results.
- Disable startup apps that respawn after a reboot mid-test day.
I keep a short checklist taped near the bench for a reason. One forgotten launcher update has ruined more “mystery regressions” than bad drivers ever did.
Selecting Games and Repeatable Test Paths
Pick titles that stress different parts of the stack. Dense simulation and open-world engines lean on the CPU. Path-traced single-player scenes lean on the GPU. CPU bottlenecks manifest differently in dense open-world titles compared to linear, path-traced environments, so a single genre will flatter one build and punish another without telling you why.
Build a 60-Second Route
Live multiplayer and dynamic AI inject noise you cannot replay. Design a specific 60-second traversal route inside the game world: same spawn, same camera line, same interactions, no random encounters if you can avoid them. Manual paths take discipline. They also produce data you can defend.
Route Discipline
Script the path on paper before the first timed run. If a spawn or cutscene can fire randomly, rewrite the route until it cannot.
Built-In Benches Versus Manual Runs
Built-in benchmarks are highly repeatable. They are also frequently less demanding than real play. Scripted fly-through cameras often bypass active physics and AI calculations, so the output underrepresents live gameplay stress. I use built-ins as a quick sanity check, then trust the manual 60-second path when the question is “how does this feel to play?”
Capturing and Interpreting the Performance Data
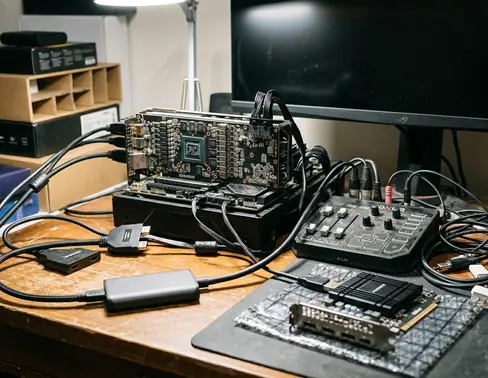
Overlay and logging tools do the heavy lifting. MSI Afterburner with RivaTuner Statistics Server, or CapFrameX, can present frame times on screen and write them out for later review. Configure the software tools & capture stack to log frame times to a CSV file so you can inspect the distribution after the run instead of squinting at a fleeting overlay.
Three Runs, Then Average
A single pass can catch a Windows service waking up at the worst moment. Execute three consecutive 60-second runs on the same path and average the results. Discard an obvious outlier only when you can point to a concrete interruption—never because the number bruised an expectation.
Read averages beside 1% lows and the frame-time plot. If the mean looks strong and the tail collapses, you found a smoothness problem, not a raw throughput win. That is the whole point of logging milliseconds instead of celebrating a single FPS tile.
The Reality of Frame Pacing
Peak clocks make marketing slides. Frame pacing makes the session.
Performance, in practice, is the width of the worst gaps between frames. A clean average with uneven delivery still reads as stutter because your eyes track the outliers, not the mean. That is why the methodology above obsesses over warm-up, path control, CSV logs, and repeated runs: each step exists to expose inconsistency instead of burying it.
At 60 frames per second, a system has exactly 16.67 milliseconds to render each frame. A single frame that takes 33.33 milliseconds halves the instantaneous rate on the spot—and that is the stutter you actually see.